
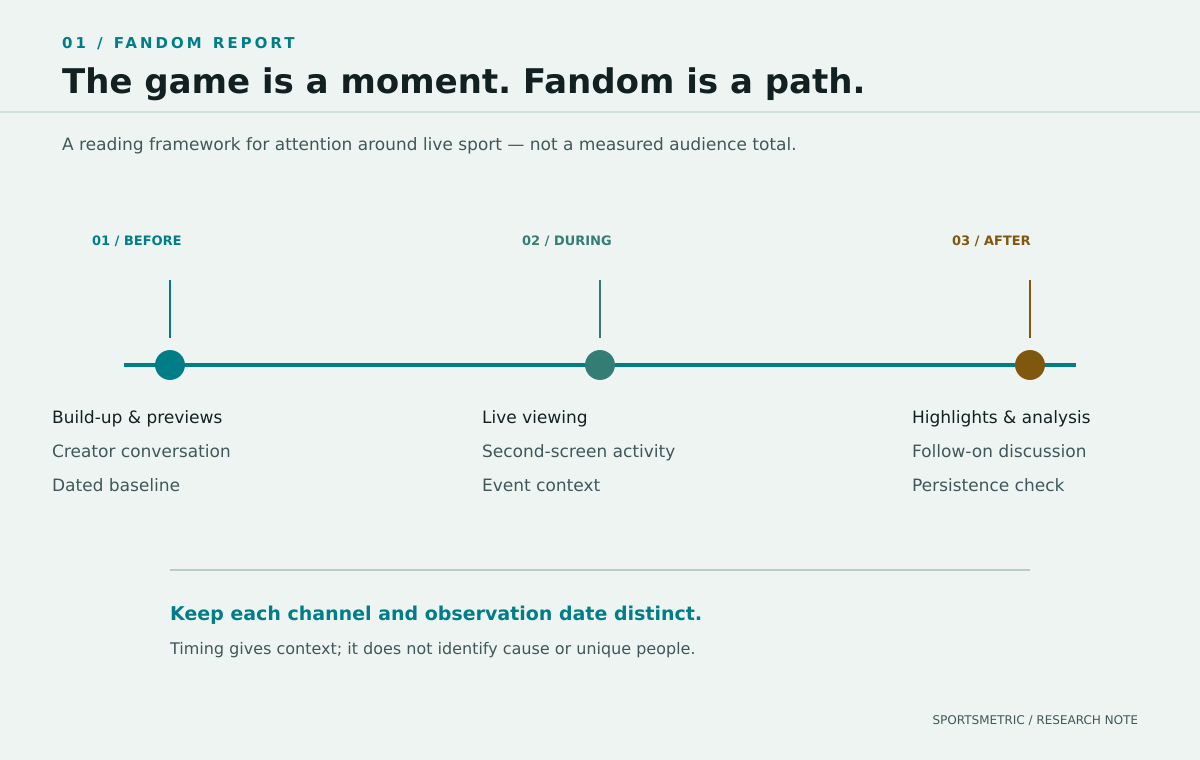
Download the cited fandom report (PDF, free, no signup)
The live game is doing fine. The measurement is incomplete.
Start with a number that complicates the usual story about short attention spans. Nielsen initially reported an average audience of 127.7 million for Super Bowl LIX in its February 11, 2025 release, a record at the time. The estimate included reported television and digital outlets and out-of-home viewing. Whatever else is happening to media consumption, a major live sporting event can still bring an enormous audience together. [4]
Women’s basketball supplies another example. ESPN reported an average of 1.3 million viewers across its 25 WNBA regular-season games on ESPN networks in 2025, up 6% year over year, using Nielsen Big Data + Panel. That is a specific set of broadcasts, not an audience estimate for the entire league or a count of unique WNBA fans. It is nevertheless evidence of demand for the live product. [5]
Now put those figures beside a different observation. In PwC’s 2024 survey of about 2,000 sports fans, only 19% of younger respondents, aged 18–34, said they watched an entire game when viewing at home. Nearly 70% said they used social media while watching sports at home. These findings describe reported behavior within a survey, not a measured decline in broadcast audiences. [2]
There is no need to force these results into a contradiction. A fan can value the live game, miss part of it and follow the surrounding conversation. The commercial mistake is to assume that one viewing measure describes all of those activities.
A note on where this report starts
PwC’s Sports Industry Outlook 2026 prompted this report. Its discussion of year-round digital engagement, creator-led media and changing ownership economics asks useful questions about where the business of sport is going. We credit that work here and link to it below. This is Sportsmetric’s own analysis of the marketing implications, informed by additional research from Deloitte, Nielsen, ESPN and the Aspen Institute. [1]
We have deliberately taken a narrower question than an industry-wide outlook: what should a marketer know about sports attention before choosing a partner, buying media or judging an activation? Stadium development, league finance and coaching technology all matter. They do not belong in the same measurement framework simply because they happen in sport.
The numbers we are using—and what they actually describe
These figures are useful together as context. They are not comparable units, and they should never be added into a total addressable audience. The 2026 date on this report identifies its publication edition; the underlying observations come from the periods below.
| Finding | Period and source | Scope to preserve |
|---|---|---|
| 19% of younger respondents said they watched an entire game at home | PwC sports-fan survey, published July 2024 [2] | Respondents aged 18–34; self-reported behavior, not a TV rating |
| 56% of Gen Z respondents found social content more relevant than TV shows and movies | Deloitte Digital Media Trends, 2025 [3] | US entertainment survey; not limited to sports fans |
| 127.7 million estimated average viewers for Super Bowl LIX | Nielsen release, February 11, 2025 [4] | Reported combined outlets and viewing environments; not social reach |
| 1.3 million average viewers across 25 WNBA regular-season broadcasts | ESPN networks, 2025 regular season [5] | ESPN network sample; not the entire league or unique fans |
| More than $40 billion in estimated annual family spending on youth sports | Aspen Institute analysis using its 2024 parent survey and other research [6] | Family spending on sports activities; not software or advertising revenue |
The creator is part of the sports media plan
The athlete interview used to be a segment inside someone else’s program. It can now be the program. Athlete-hosted podcasts, creator commentary and platform-native highlights give fans more ways to follow a sport, with a different host and a different reason to return.
Deloitte’s 2025 Digital Media Trends findings help explain the appeal. Among US respondents, 56% of Gen Zs found social media content more relevant than traditional TV shows and movies; 52% felt a stronger personal connection to social media creators than to TV personalities or actors. The research covers entertainment broadly. It does not prove that a particular sports creator drives ticket sales, but it gives marketers a reason to take the format seriously. [3]
PwC’s outlook points to creator access programs, athlete-led shows and co-streaming as evidence of a changing sports media business. Its expectation that creator access clauses will become more common in rights deals is a forecast, not a tally of clauses already signed. The underlying buying question is current: does the rights package reach the people shaping the conversation, or only the official broadcast? [1]
For a brand, the practical unit of research is often a relationship: an athlete appearing on a creator’s channel, a team granting access, or a sponsor participating in a recurring format. A follower total says little about that relationship. The content, its timing and the response to it are the material worth examining.
This also argues against treating creators as interchangeable ad inventory. A technically large account may be a poor match for a particular story. A smaller account may have access, continuity or a recognizable editorial point of view that makes it worth investigating. That is a judgment to support with evidence, not a reason to invent an authenticity score.
A final lasts hours. The decision window is longer.
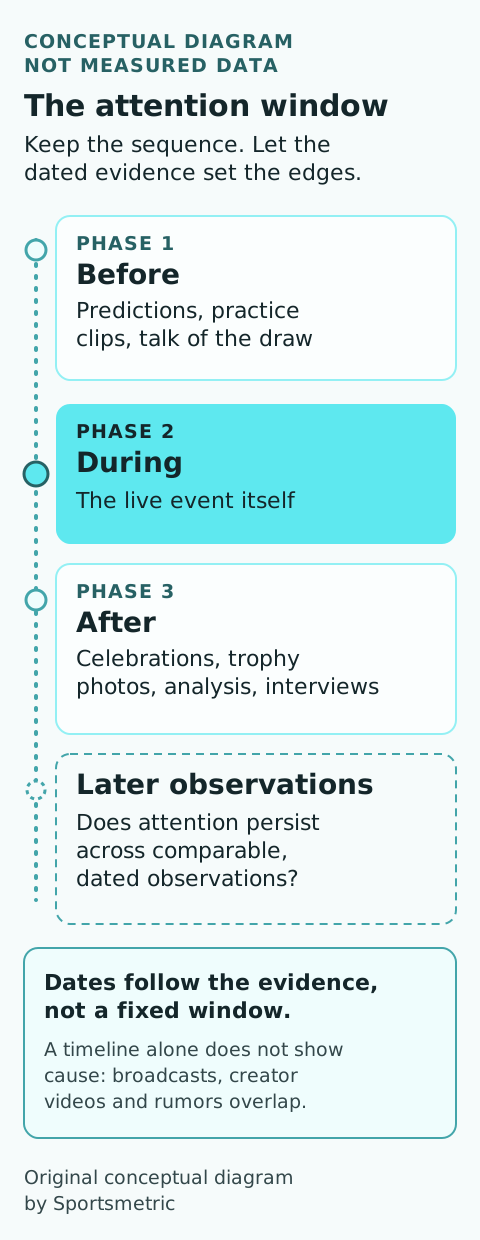
Consider the marketing brief around a tennis final. Before the match, there are predictions, practice clips and discussion of the draw. After it, there are celebrations or disappointment, trophy photographs, analysis and interviews. A sponsor entering the conversation on Monday is participating in a different moment from one posting before the first serve.
A match-day report compresses those differences. A more useful account keeps the sequence: what was happening before, what changed during the event, and what remained afterward. The dates should follow the evidence. A fixed seven-day window may be convenient for comparison, but convenience does not establish when public interest began or ended.
Persistence matters. If an athlete’s recorded audience rises around a final, a marketer should ask whether subsequent observations retain the increase and whether later content continues to attract activity. That is not the same as measuring customer retention. It is a narrower test of whether the observed attention lasted.
Nor does the timeline identify cause on its own. Broadcast exposure, a creator’s video, a transfer rumor and a platform correction can occur close together. The honest conclusion may be that several plausible explanations overlap. A useful report preserves that uncertainty instead of assigning the whole change to the event with the most convenient date.
Owning the fan relationship is a different business from observing it
PwC’s digital-engagement work makes a strong case for teams building a year-round relationship through their own platforms. Streaming, membership, commerce and personalized content can give an organization a more direct understanding of participating fans. But access to that information is precisely what separates a first-party customer relationship from a public social observation. [7]
An athlete’s public follower count does not reveal which followers bought a ticket. A successful clip does not identify every person it reached across other platforms. A product visible in a photograph does not prove a paid sponsorship. These are not small technical qualifications; they determine which business question the data can answer.
There is a counting problem too. The person watching the broadcast may also see the clip and listen to the podcast. Adding the three audiences can make a presentation look stronger while telling the buyer less about actual reach. Without a defensible way to account for overlap, report the channels separately.
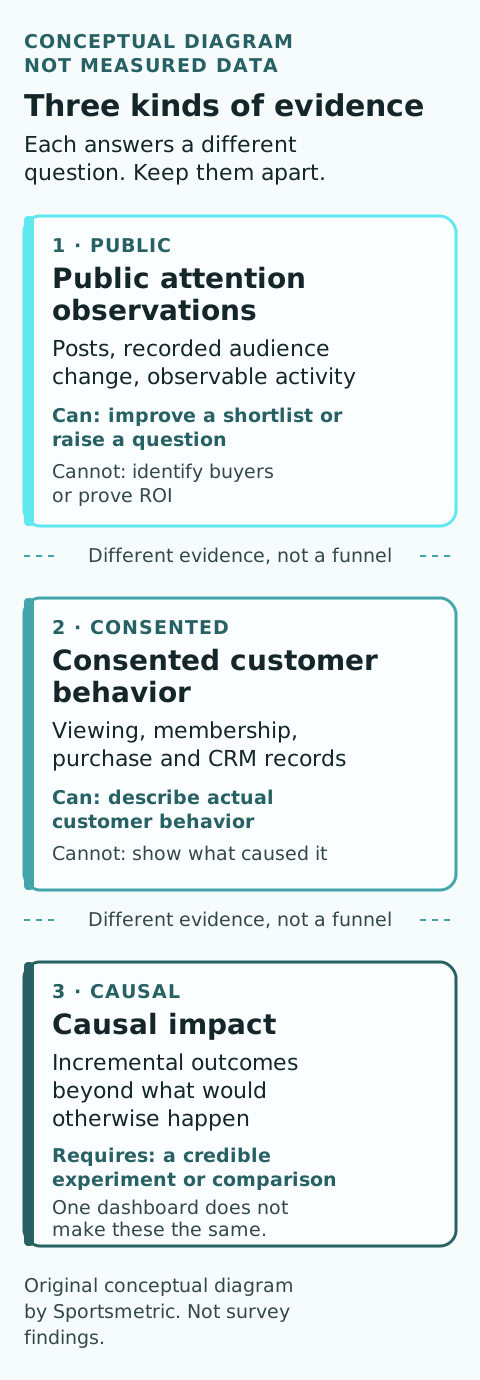
We would separate a marketing review into three parts. First, public attention: content, recorded audience change and observable activity. Second, the known customer relationship: consented viewing, membership, purchase and CRM records. Third, incremental impact: evidence that an intervention changed an outcome beyond what would otherwise have happened.
The first part can improve a shortlist or suggest a question. The second can describe actual customer behavior. The third needs a credible evaluation design, such as a suitable experiment or comparison. Putting all three in one dashboard does not make them the same kind of evidence.
Growth needs an explanation, not just a bigger number
Youth sports offers a useful warning for anyone presenting a market-growth chart. Aspen’s Project Play analysis estimated more than $40 billion in annual US family spending on children’s sports activities. Its nationally representative survey of 1,848 youth-sports parents, conducted in late 2024, found average spending of $1,016 on a child’s primary sport, 46% above 2019. [6]
The same article describes participation challenges and unequal access. An expanding spending total can reflect families paying more, not simply more children playing. Aspen also distinguishes that family-spending estimate from the broader economy, which includes other sources of expenditure.
For investors, this is a reminder to separate market size, adoption, pricing and retention. For brands, it is a reminder that a commercially attractive category can contain affordability problems. Calling the entire spending estimate a software or advertising opportunity would miss what families are actually paying for—and why.
The same discipline belongs in audience research. A large percentage increase from a tiny starting account is different from a substantial increase on an established one. Look at the starting base, absolute change, observation quality and duration before calling something momentum.
What we would ask before approving a sports marketing recommendation
The most useful change to a marketing brief may be fewer vague promises. “Reach younger fans” is not yet a decision. Which fans, in which market, through which format, and with what evidence that the proposed partner is relevant?
Before approving a recommendation, we would want answers to five questions:
- Who are we trying to reach, and which parts of that audience description are measured rather than assumed?
- Which athletes, teams and creators appear in the relevant content, and what records support those relationships?
- Is the attention tied to one moment, or does it persist across comparable observations?
- What does the proposed activation ask people to do, and which data could show that behavior?
- What result would make us change our recommendation—including evidence that the apparent opportunity is weaker than it first looked?
Where Sportsmetric fits
Sportsmetric focuses on the research before and around a marketing decision: recorded social audiences, available posts, sports-moment context and source-backed brand activity. Those records can help a team investigate an athlete’s momentum, review a creator relationship or examine the public evidence behind a partnership story.
We do not turn those observations into verified fan identity, guaranteed brand affinity or a causal ROI claim. Coverage varies by profile, platform and date. If the evidence is missing, it is missing; a plausible narrative cannot supply it.
A marketer still needs licensed media measurement, first-party customer data or an appropriate study for questions outside that scope. Our argument is that the earlier research deserves care too. A shortlist built from dated, inspectable evidence is a better starting point than one built from fame and a few impressive screenshots.
Sources, scope and editorial method
This is a Sportsmetric desk-research report published October 30, 2026, not a new Sportsmetric survey, an independent product benchmark or a full-year measurement of 2026. The opening owes its research context to PwC’s Sports Industry Outlook 2026. The argument, organization and marketing recommendations are Sportsmetric’s. PwC and the other cited organizations have not endorsed this report.
We reviewed the primary sources linked below and retain their original populations, periods and metric definitions. The selected evidence includes survey findings published in 2024 and 2025, 2025 audience reports, and PwC’s 2026 outlook. Broad entertainment findings are identified as such. Figures are not combined into a cross-platform audience total or used to infer commercial returns.
Our separate Sports Marketing & Fan Attention Report 2026 contains findings from a defined tracked sample. This report serves a different purpose: interpreting external evidence for sports marketing decisions. Predictions remain attributed predictions; hypothetical examples illustrate a question rather than report a measured case.
Continue your research
Sources and further reading
- [1] PwC — Sports Industry Outlook 2026: inspiration and industry context
- [2] PwC — Engaging younger sports fans, July 29, 2024: survey of about 2,000 sports fans
- [3] Deloitte — Digital Media Trends, March 25, 2025: US entertainment survey findings
- [4] Nielsen — Super Bowl LIX audience estimate, February 11, 2025
- [5] ESPN — WNBA regular-season audience across 25 ESPN-network games, September 12, 2025
- [6] Aspen Institute Project Play — family spending analysis and 2024 parent-survey methodology
- [7] PwC — Digital fan engagement is the front door to fandom, January 22, 2026